
MAXIMISING THE VALUE OF YOUR INSPECTION DATA
Targeted assessments to address critical asset integrity questions:
-
Is my pipeline operating safely?
-
Are any actions required to remain compliant with regulations?
-
Do any identified anomalies need more advanced assessment?
-
Will intervention or rehabilitation be necessary?
-
When should the next inspection be scheduled?
HOW OUR INTEGRITY ASSESSMENT SERVICE WORKS
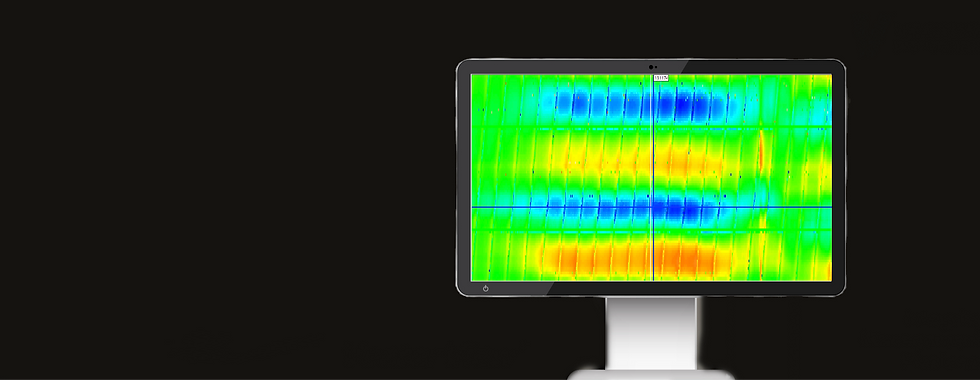
PAUT-PIG™ or HEATER-PIG™ raw A-Scan ultrasonic data is uploaded into the VECTOR-VIEW™ platform following a successful inspection run in your asset. The raw A-Scan ultrasonic signals will be processed into Phased Array wall thickness and inner/outer radius colour maps to rapidly analyse and report on the results by experienced and qualified Phased Array data analysts.
KEY ASSESSMENT CAPABILITIES

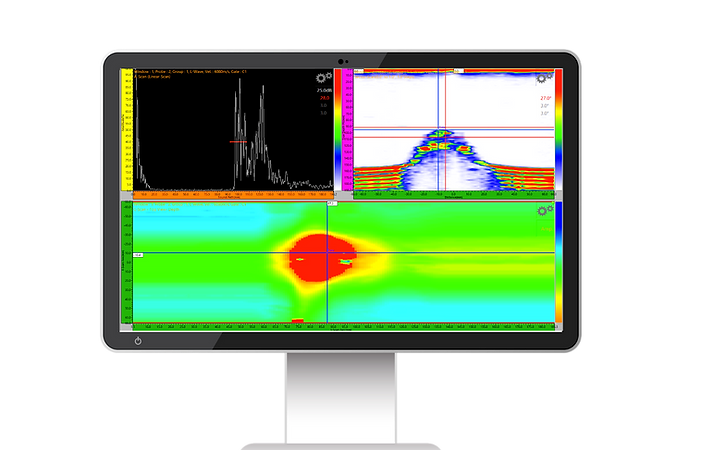
Advanced Phased Array Data Analysis

Raw UT
A Scan
Data Analysis

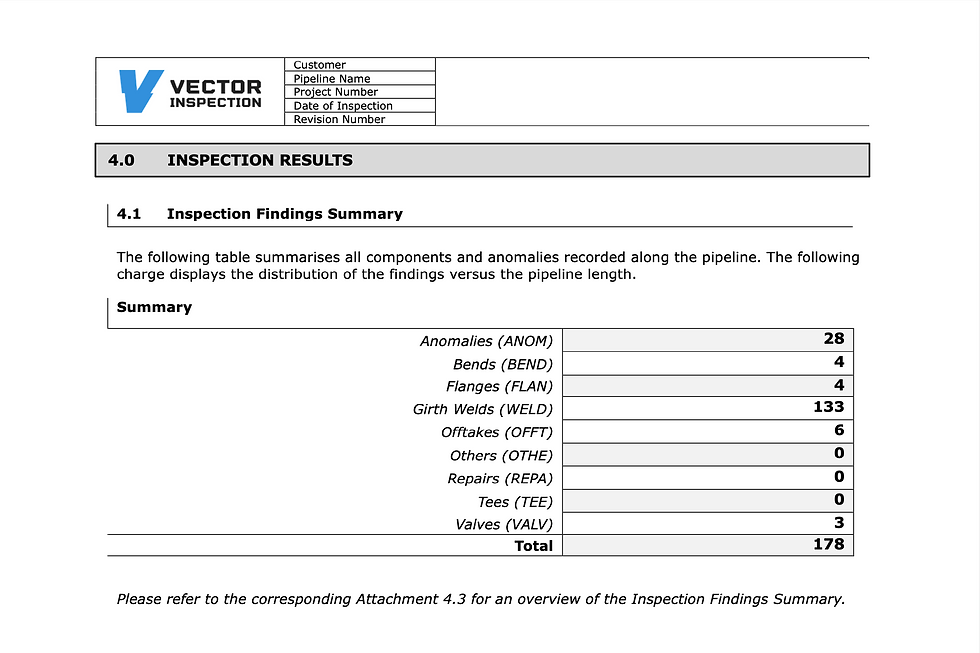
POF 100 Standard
Reporting

B31.G and Modified B31.G Anomalies

Dent Strain and Bend Strain Analysis

Google Earth XYZ Mapping
GPS Routes

Run to Run Report Comparisons

Rapid Reporting and On-Site Viewing

Pipeline Movement and Geohazards

Fitness-for-Service
(FFS)
MAKE INFORMED DECISIONS ON YOUR ASSETS HEALTH
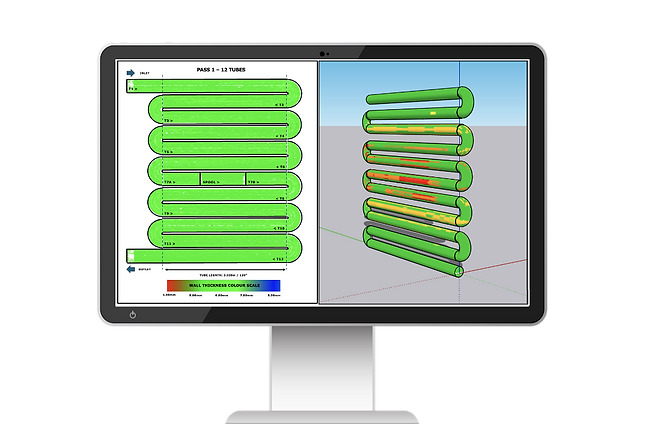
Our service provides asset owners with clear, actionable insights that directly enhance both the health and efficiency of their infrastructure. 2D and 3D data asset views are available to visually share the data in an easy to understand format for actionable decision making.

GET A QUOTE FOR OUR
ASSESSMENT SERVICE
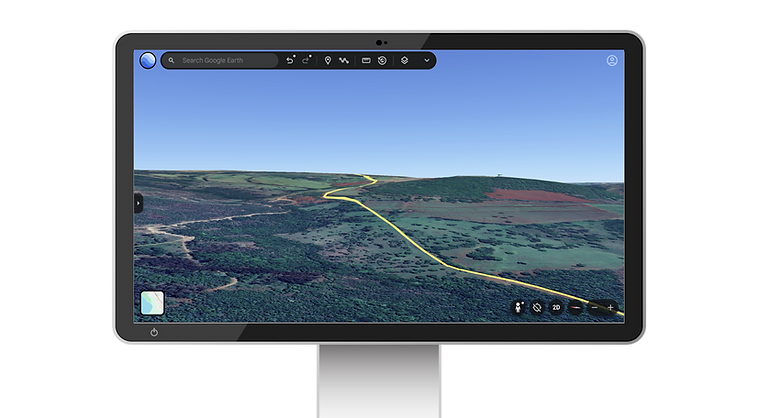
ACCURATE PIPELINE MAPPING REPORTS WITH GPS REFERENCE POINTS
Our Accurate XYZ mapping reports provide precise pipeline location data along the entire route. The results are displayed in Google Earth, allowing intuitive 3D visualisation and route verification. This ensures easy integration with GIS systems and supports planning and monitoring.
INSPECTION REPORTS AVAILABLE

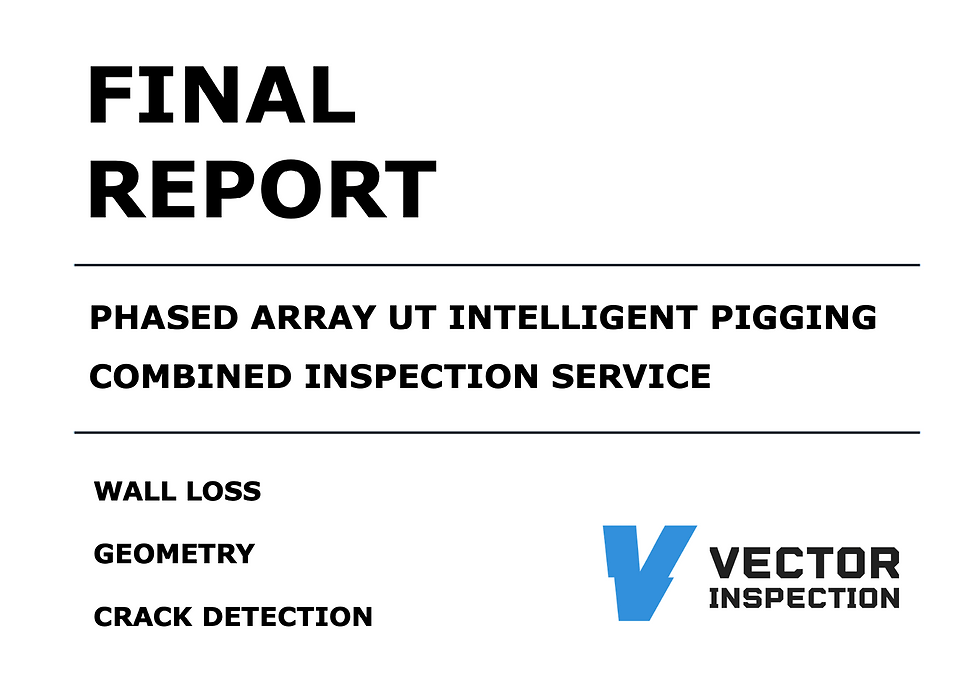
Crack Detection Report (POF 100)
Our Crack Direction Report provides a detailed assessment of circumferential, axial and SCC crack orientation and propagation within the pipeline. A pipe tally and dig sheets are issued with the length, depth, and direction of crack growth to support accurate integrity evaluations. This information helps operators prioritise repairs and mitigate future failures.

Wall Loss Report (POF 100)
Our Wall Loss Report delivers precise measurements of metal loss throughout the pipeline. The pipe tally and dig sheets highlight thinning caused by corrosion, erosion, or other degradation mechanisms. Operators can use this dig sheets in the report to make any repairs if necessary and forecast remaining life and plan maintenance activities effectively.

Geometry Inspection Report (POF 100)
Geometry Report maps deviations in pipeline shape and alignment. It captures dents, ovalities, buckles, wrinkles and other geometric irregularities that may impact flow or structural integrity. The pipe tally and dig sheets ensures safe operations by enabling anomaly size and location to conduct proactive corrective action.

XYZ Mapping Report
Our XYZ Mapping Report provides precise GPS positional data of the pipeline along its entire route using a combination of onboard IMU and AGM synchronisation. This enables accurate pipeline tracking, route verification, and integration with GIS systems. A KMZ file is supplied for Google Earth, allowing easy visualisation and planning.

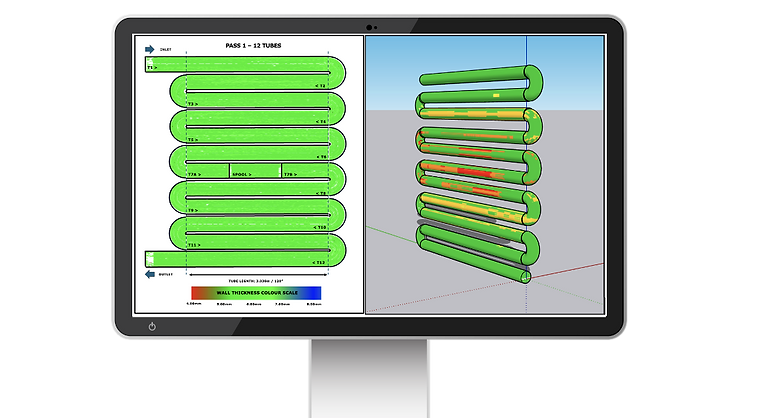
Tube and Coil Inspection Report
Our Furnace Tube & Coil Report delivers a clear evaluation of crack detection, wall loss, and geometry changes within the tubes and coils. Results are presented in a simple table format for quick reference and decision-making. In addition, 2D and 3D colour maps provide a visual representation of the inspection data.

Cleanliness and Decoking Verification
The Cleanliness & Decoking Verification Report confirms the effectiveness of furnace tube cleaning operations. It provides clear evidence of tube condition, showing the level of deposits removed and overall cleanliness achieved. Results are presented in an easy-to-read format, supported by visual mapping where required. This ensures optimal heat transfer performance.

Corrosion Growth Assessment (CGA)
The Corrosion Growth Assessment Report evaluates changes in wall thickness over time to identify active corrosion areas. By comparing inspection data sets, it calculates corrosion rates and highlights high-risk zones. Results are clearly presented in tables and visual plots for straightforward interpretation. This enables operators to predict remaining life,

Remaining Life Assessment (RLA)
The Remaining Life Assessment Report provides a clear estimate of how long an asset can safely operate before intervention is required. Using inspection data and material properties, it calculates safe operating limits and future risk. Results are presented in tables and charts for easy understanding. This empowers operators to plan maintenance and extend asset life.

Immediate Pipeline Integrity Assessment
The Immediate Pipeline Integrity Assessment Report delivers a rapid evaluation of current pipeline condition following inspection. It identifies any critical defects that may threaten safe operation and prioritises necessary actions. Results are summarised in a clear format to support fast decision-making. This ensures operators can respond quickly to any threats.

Fitness-for-Service / Fitness-for-Purpose (Level 2)
The Fitness for Service Level 2 Report provides a detailed engineering assessment of identified defects using industry standards. It evaluates whether cracks, wall loss, or geometric anomalies affect the pipeline’s ability to operate safely. Advanced calculations and modelling are applied to ensure accurate results.

Fitness-for-Service / Finite Element Analysis (Level 3)
The Fitness-for-Service Level 3 Report uses Finite Element Analysis (FEA) to simulate the behaviour of complex defects under real operating conditions. This advanced assessment goes beyond standard calculations, modelling stresses and strains with high precision. It provides detailed insight into the true impact of cracks, wall loss, or geometry changes.

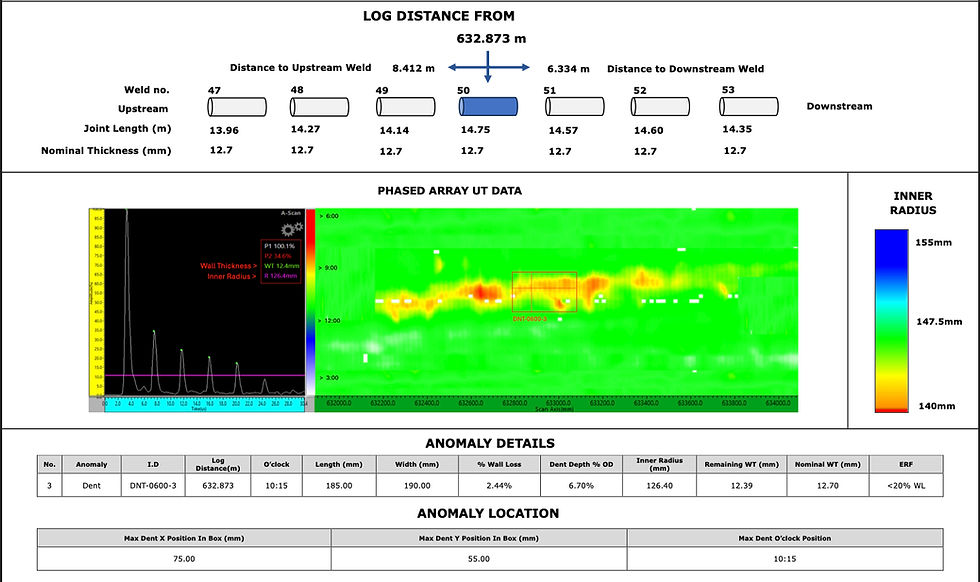
Dent Strain and Profile Characteristic Assessment
The Dent Strain & Profile Characteristic Assessment Report evaluates dents to determine their severity and potential impact on pipeline integrity. It measures dent depth, shape, and associated strain levels using high-resolution inspection data. Results are presented in tables and visual plots for clear interpretation.

Bend Strain Assessment
The Bend Strain Assessment Report evaluates pipeline curvature to determine strain levels resulting from external forces such as ground movement or construction activities. Using data from Inertial Measurement Units (IMUs) we identify areas of high curvature and assess the associated bending strain. This analysis helps prioritise remediation efforts.

Pipeline Cracks in Dents Diagnosis
The Pipeline Cracks in Dents Diagnosis Report identifies and evaluates cracks that occur within dented sections of a pipeline. Using high-resolution inspection data, it determines crack size, orientation, and severity. Results are presented in tables and graphs for easy interpretation. This allows operators to prioritise repairs and reduce risk.

Pipeline Movement and Geohazard Assessment
The Pipeline Movement and Geohazard Assessment Report evaluates pipeline displacement and the impact of environmental hazards such as landslides, erosion, or ground settlement. Using in-line inspection data and geotechnical analysis, it identifies high-risk areas and quantifies stress on the pipeline. Results are presented in clear tables and visual maps for easy interpretation.


